
The RSI Advantage
1. RSI Basics: Measure Market Momentum
The Relative Strength Index (RSI) is a momentum oscillator that tracks price speed and changes, helping traders spot potential entry and exit points.
- Scale: 0 to 100
- Key Levels: Above 70 = overbought, Below 30 = oversold
- Think of RSI as a market heartbeat monitor—showing when the market is racing too fast or slowing down.

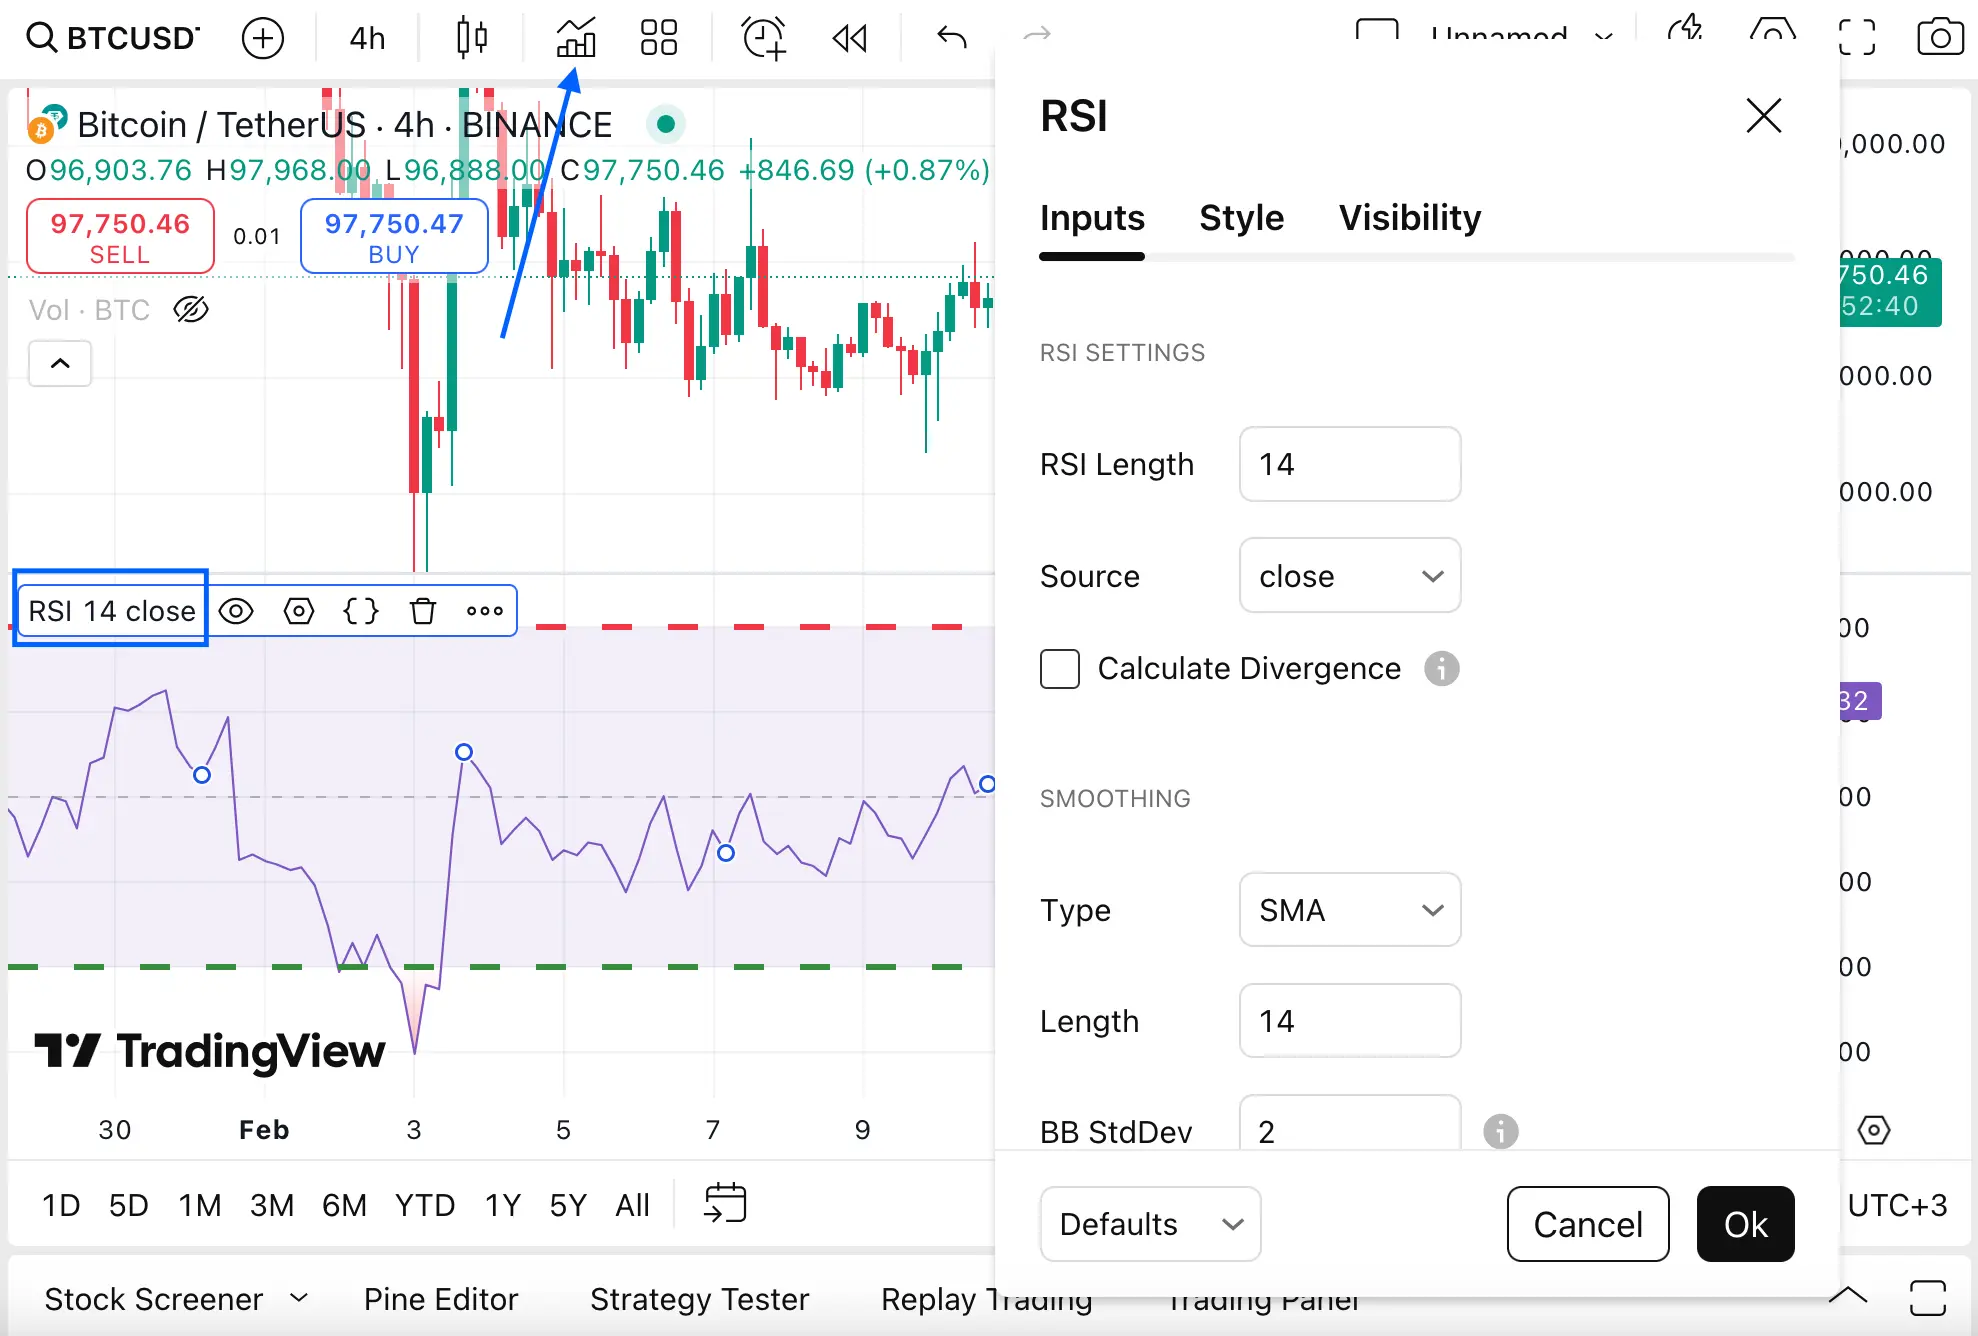
2. Easy RSI Setup
Setting up RSI is simple:
- Navigate to the indicators section on your trading platform.
- Select RSI, and it will overlay onto your chart.
- The default 14-period setting works well, but you can tweak it to fit your strategy.
3. Reading RSI Signals
- Above 70 → Overbought: Potential sell signal.
- Below 30 → Oversold: Potential buy signal.
- Between 30-70: Watch for trend shifts as RSI crosses these key thresholds.
4. Overbought Alerts: When to Sell
An RSI above 70 is a red flag that the market may be overheated. Prices might soon correct, making it a good time to:
✔ Lock in profits on long positions.
✔ Look for short-selling opportunities.

5. Oversold Insights: When to Buy
An RSI below 30 signals that the asset may be undervalued and could soon rebound. Consider:
✔ Entering a buy position if RSI starts moving upward.
✔ Waiting for confirmation before making a move.

6. Trade Execution: Buy & Sell Signals
✅ Bullish Signal: Buy when RSI crosses above 30, indicating a price recovery.
❌ Bearish Signal: Sell when RSI drops below 70, signaling a potential reversal.
Master RSI & Elevate Your Trading
RSI is a powerful tool that helps traders identify market momentum and strategic entry/exit points. Practice using RSI in your trades today and transform your decision-making with data-driven precision! 🚀